Forex Trading: A Beginner's Guide
What Is Forex?
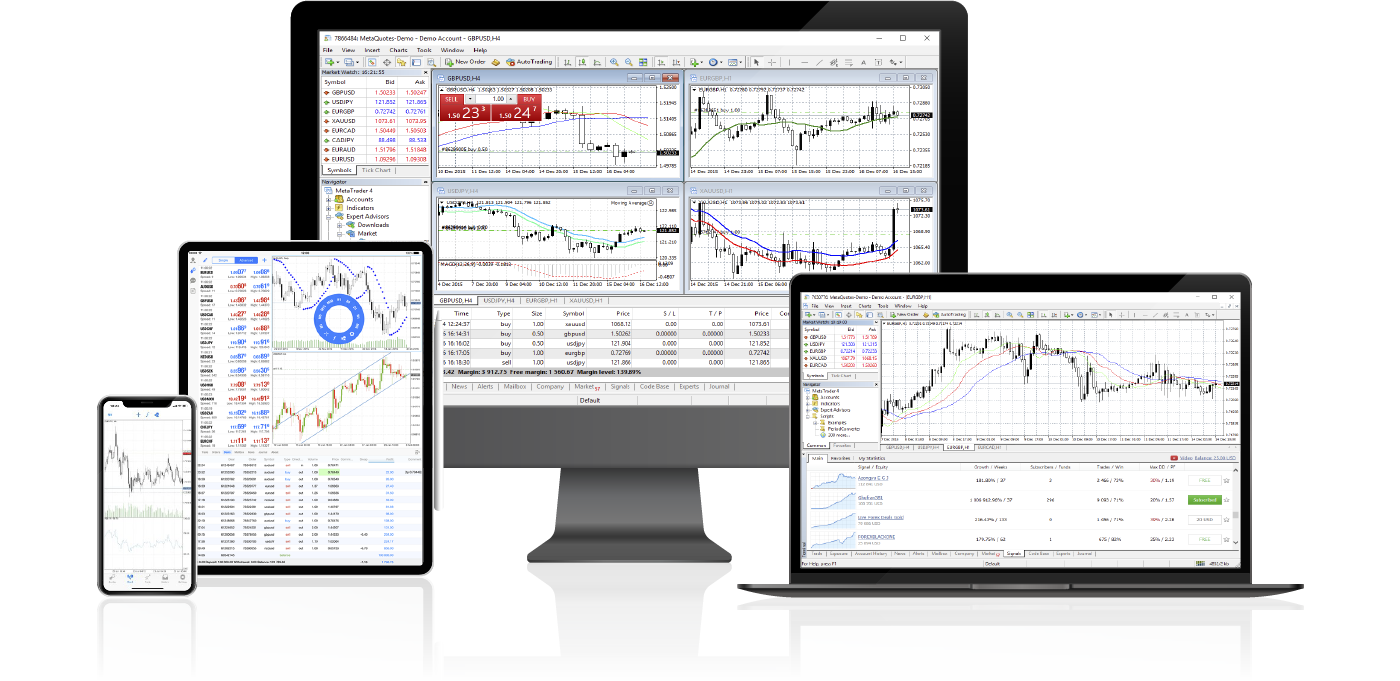
Forex (FX) is the marketplace where various national currencies are traded. The forex market is the largest, most liquid market in the world, with trillions of dollars changing hands every day. There is no centralized location, rather the forex market is an electronic network of banks, brokers, institutions, and individual traders (mostly trading through brokers or banks).
Currencies trade against each other as exchange rate pairs. For example, EUR/USD.
The forex market is open 24 hours a day, five days a week, except for holidays. Currencies may still trade on a holiday if at least the country/global market is open for business.
What Is A Spread In Forex Trading?
A spread in trading is the difference between the buy (offer) and sell (bid) prices quoted for an asset. The spread is a key part of CFD trading, as it is how both derivatives are priced. Many brokers, market makers and other providers will quote their prices in the form of a spread.
This means that the price to buy an asset will always be slightly higher than the underlying market, while the price to sell will always be slightly below it.
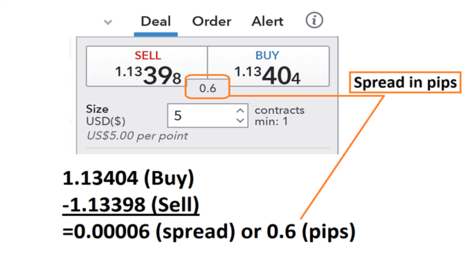
Below we can see an example of the forex spread being calculated for the EUR/USD. First, we will find the buy price at 1.13398 and then subtract the sell price of 1.3404. What we are left with after this process is a reading of .00006. Traders should remember that the pip value is then identified on the EUR/USD as the 4th digit after the decimal, making the final spread calculated as 0.6 pips.
What Is A Pip And What Does It Represent?
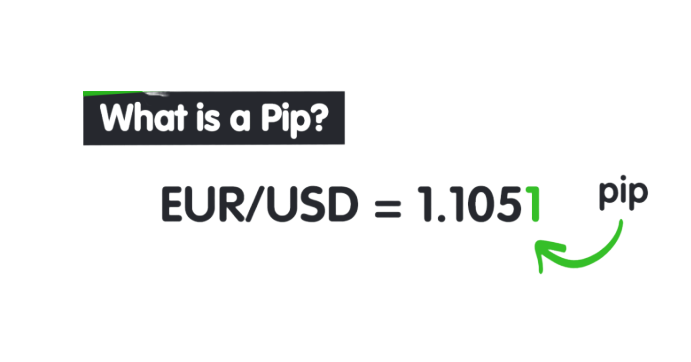
A pip, short for percentage in point or price interest point, is known to be the smallest numerical price move in the exchange market. When a price changes on the exchange it is generally referred to as a Pip/s or Pipette change. As most currency pairs are priced to 4 decimals places ($0.0001) the smallest change would be to the last number after the decimal point for example: $0.0001 which is illustrated as the one indicated on this example. The difference between a pip and pipette is simply a 5 decimal place and not 4 such as a pip.
This can be calculated very simply: POSITIONS SIZE X 0.0001 = MONETARY VALUE OF A PIP
Here is a quick example using the EUR/USD as we have above:
We open a position size of 10,000 units and calculate the pip value as follows: 10,000 (units) x 0.0001 (one pip) = $1 per pip.
Difference Between Buy/Sell Stops & Buy/Sell Limits?
A buy stop order would be an order to buy the market at a price above the current price. It's just the inverse with sell orders.
A sell limit order would be an order to sell the market at a price above the current price. A sell stop order would be an order to sell the market at a price below the current price.
A limit order sets a specified price for an order and executes the trade at that price.
A buy limit order will execute at the limit price or lower. A sell limit order will execute at the limit price or higher. Overall, a limit order allows you to specify a price.
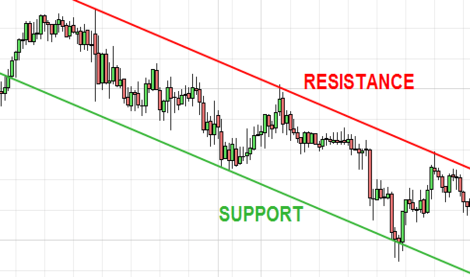
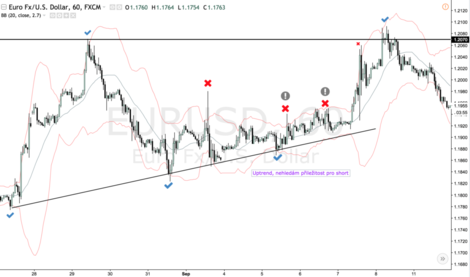
What Is Support And Resistance?
Support is the level at which demand is strong enough to stop the stock from falling any further. In the image above you can see that each time the price reaches the support level, it has difficulty penetrating that level. The rationale is that as the price drops and approaches support, buyers (demand) become more inclined to buy and sellers (supply) become less willing to sell.
Resistance is the level at which supply is strong enough to stop the stock from moving higher. In the image above you can see that each time the price reaches the resistance level, it has a hard time moving higher.
The rationale is that as the price rises and approaches resistance, sellers (supply) become more inclined to sell and buyers (demand) become less willing to buy.
What Is Hedging? What Are Hedging Strategies?
Hedging is a standard practice followed in the stock market by investors to safeguard themselves from the losses that might arise from market fluctuation. In a way, hedging is the insurance that helps the investor to lessen their losses, but it does not prevent the negative things happening in the course of life or business. Hedging is followed in all walks of life like opting for car insurance, life insurance, term insurance and so on.
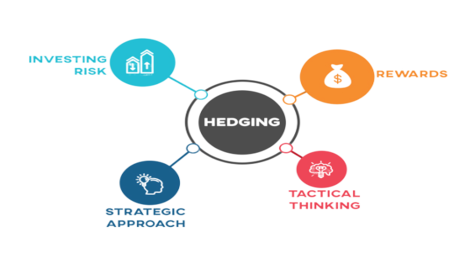
The technique of hedging is also followed at an institutional level by portfolio and fund management companies to minimize their exposure to different types of risk and to decrease its negative impact.
In the stock market, the hedging technique is used in the following areas:
Hedging is also a technique that will help the investor to gain profits by trading different commodities, currencies or securities. Hedging is of three types namely:
Hedging Strategies :
When looking for investment options, hedging helps the investor to spread their risks and reduce them to a certain extent. As the market is unpredictable so are the hedging techniques. The hedging technique will have a constant modification as per the market situation and the investment type.
Some of the common strategies followed in hedging are as follows.
Benefits Of Hedging :
Hedging offers a scalable advantage to investors and traders to effectively trade in the market. As risk is an essential part of the trading cycle and its main motive is to gain profit. However, as the market remains unpredictable, hedging offers a safety net for investors and helps them to protect themselves from market uncertainty.
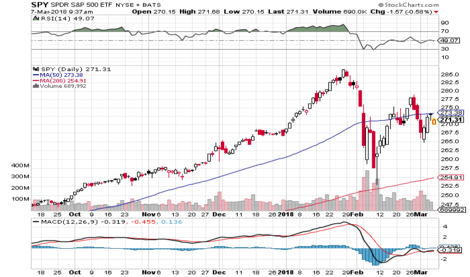
Technical Indicators : Categories And Types
Technical indicators are heuristic or mathematical calculations based on the price, volume, or open interest of a security or contract used by traders who follow technical analysis. By analyzing historical data, technical analysts use indicators to predict future price movements.
Technical analysts or chartists look for technical indicators in historical asset price data in order to judge entry and exit points for trades.
Indicators are based on mathematical formulas, for example :
the RSI indicator with the period 14 calculates the last 14 candles and gives us information accordingly.
Categories Of Technical Indicators
The main difference between the two categories is that the leading indicators are trying to analyze the market ahead and therefore we are getting signals for entry at the time when the market is not yet in trend, for example in a chop, but gradually increasing number of buyers or sellers can be evaluated by indicators as rising momentum and thus we can get a signal to enter the market.
Lagging indicators are used primarily to confirm the strength and direction of the trend in which you are already.
Types Of Indicators :
1. Trend Indicators
2. Momentum Indicators
3. Volatility Indicators
4. Volume Indicators
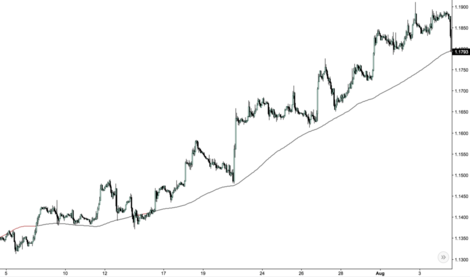
1. Trend Indicators
It is often quite easy to determine the price trend of a given pair just by looking at the price chart, but there are lots of indicators that are designed to indicate the current trend. The simple and exponential moving averages are the ones that many traders use, but you can also use other indicators such as the Supertrend, MACD and Parabolic SAR indicators.
These trend indicators are useful because they will help you trade in the same direction as the underlying trend, which is always the most profitable strategy. Plus they will also signal a change in trend, which will enable you to enter a position right at the start of a new trend.
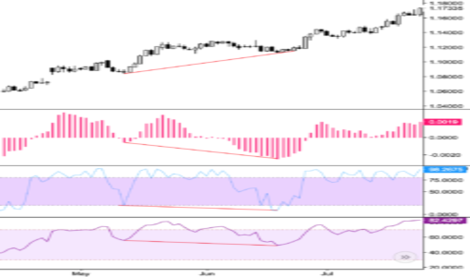
2. Momentum Indicators
The price of a particular currency pair will often trend upwards or downwards for long periods of time, but it’s often useful to know the strength of a particular trend, which is why momentum indicators are very helpful.
Examples of these indicators include RSI, Stochastics and CCI, and you will find that they oscillate from overbought to oversold as the price rises and falls. Although they are not 100% reliable, they generally indicate that the trend is starting to run out of momentum and may be about to reverse once they enter overbought or oversold territory.
3. Volatility Indicators
There will be times when the price of a particular pair is extremely volatile and whipsawing upwards and downwards, and there will be quieter times when the price is barely moving at all and is stuck in a narrow trading range.
Sometimes this is obvious, but it is always useful to use one of the volatility indicators that are available because these will give you a good indication of the volatility at any given moment. The ADX and Average True Range indicators are two of the best ones that you can use for this purpose.
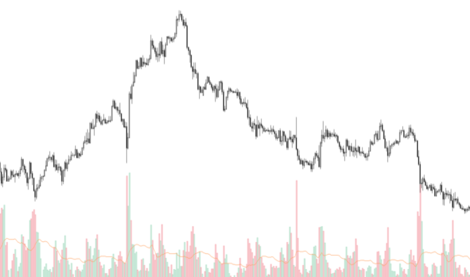
4. Volume Indicators
Volume indicators are most commonly used by stock traders because it can be hard to find volume data for individual currency pairs. In addition to the actual volume indicator, there are other volume-based indicators that you can use, such as the Chaikin Money Flow and On Balance Volume indicators, but these aren’t generally shown when looking at forex pairs because the volume data isn’t available.
So if you do want to look at the volume for a particular currency pair in order to give you an edge, you need to do some research and find a
broker or a charting platform that publishes this data, and therefore has indicators based on this data.
How To Not Use Technical Indicators?
Just be careful with the volume display when trading forex generally on metatrader platform. It does not show the right volume, but the number of price changes for the given time period.
- We introduce people to the world of currency trading, and provide educational content to help them learn how to become profitable traders. We're also a community of traders that support each other on our daily trading journey.
We will provide you latest market updates and analysis, for that you can JOIN OUR TELEGRAM CHANNEL and get daily profit and more facilities. If you want to JOIN TELEGRAM CHANNEL, click here to join.